 Hack the Box
Elastic SIEM Lab Setup
DESCRIPTION
The following post outlines a project I undertook to deepen my understanding of how to use Elastic SIEM. This project guides you through the process of setting up a basic Security Information and Event Management (SIEM) environment using Elastic SIEM, part of the Elastic Stack. The primary goal is to provide hands-on experience in security monitoring, event detection, and incident response by collecting, analyzing, and visualizing security events. The lab leverages a Kali Linux virtual machine to generate various security events, which are then captured and analyzed within Elastic SIEM.
This lab is ideal for those looking to practice and enhance their skills in using SIEM tools, understand the mechanics of security event analysis, and apply these concepts in a real-world-like environment. It serves as a straightforward introduction to the function of SIEMs and their crucial role in modern cybersecurity operations.
TABLE OF CONTENTS
INSTALLATION
Step 1: Set up a Free Trial Elastic Account
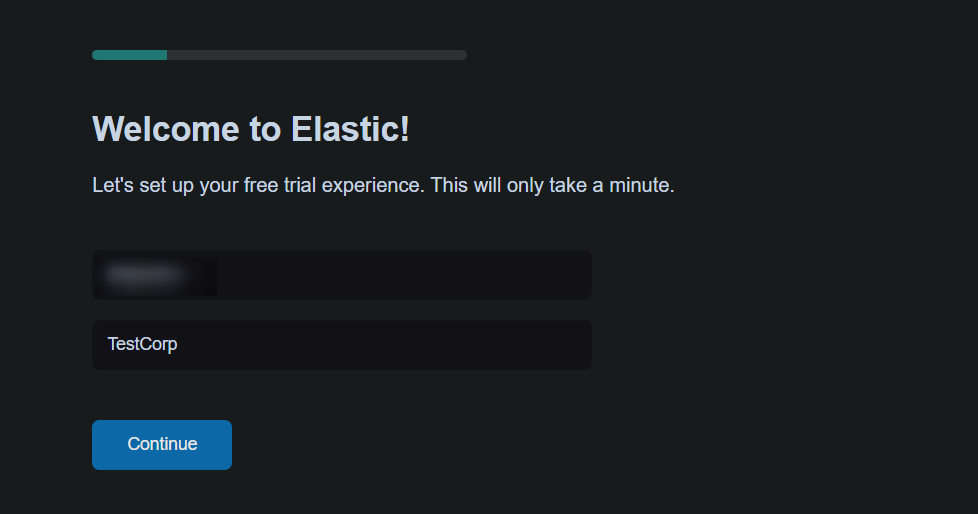
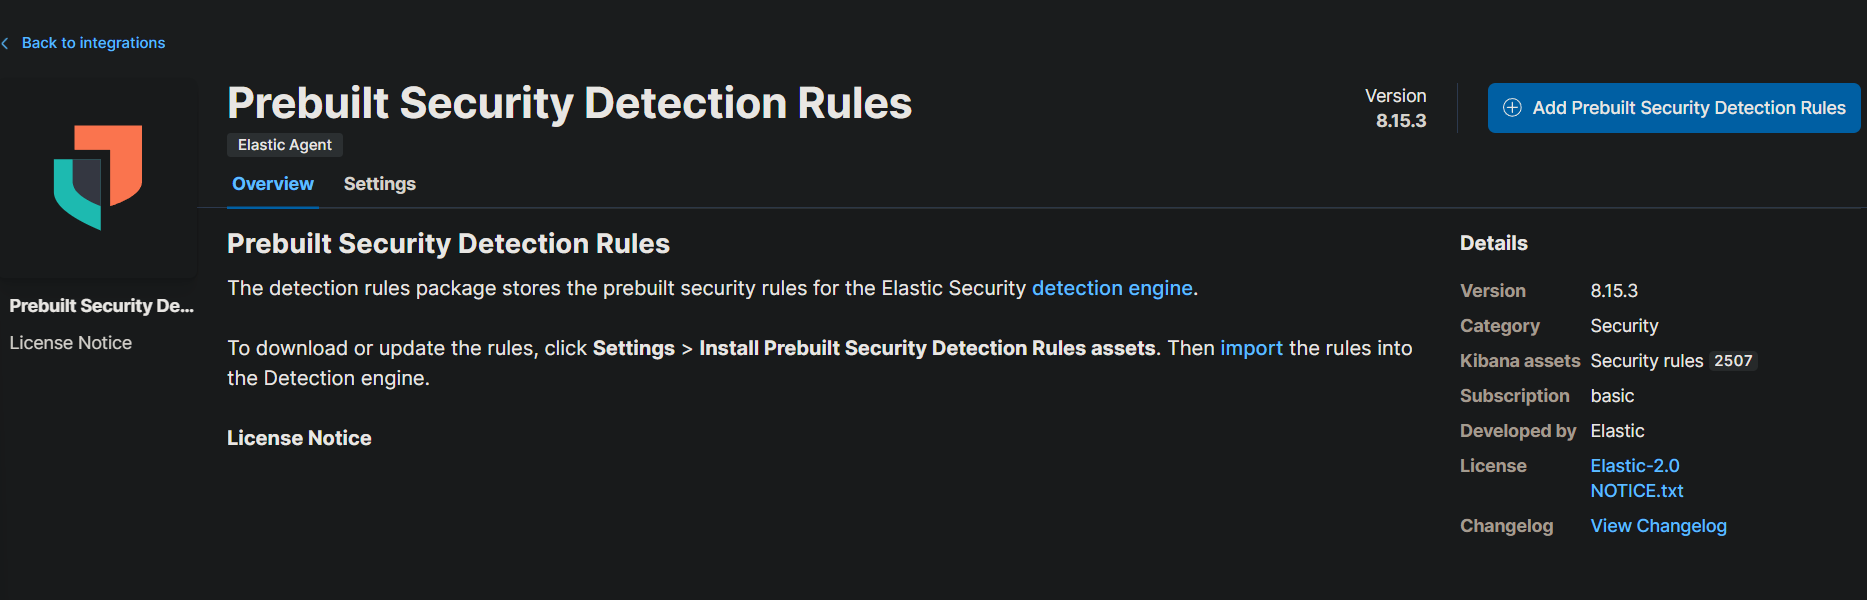
Start by creating a free Elastic account. Visit the Elastic registration page, sign up, and verify your email. Once verified, log in to the Elastic Cloud console. Begin your free trial and create an Elasticsearch deployment by choosing a cloud provider, region, and deployment size—default settings are usually fine for this lab. After setting up the deployment, install Elastic’s prebuilt rules from the Security section under the Detections tab to start monitoring for security events.
Step 2: Setting up the Agent to Collect Logs
An agent is a software program installed on a device, such as a server or endpoint, to collect and send data to a centralized system for analysis and monitoring. In the context of Elastic SIEM, the agent is crucial for collecting and forwarding security-related events from your endpoints to your Elastic SIEM instance.
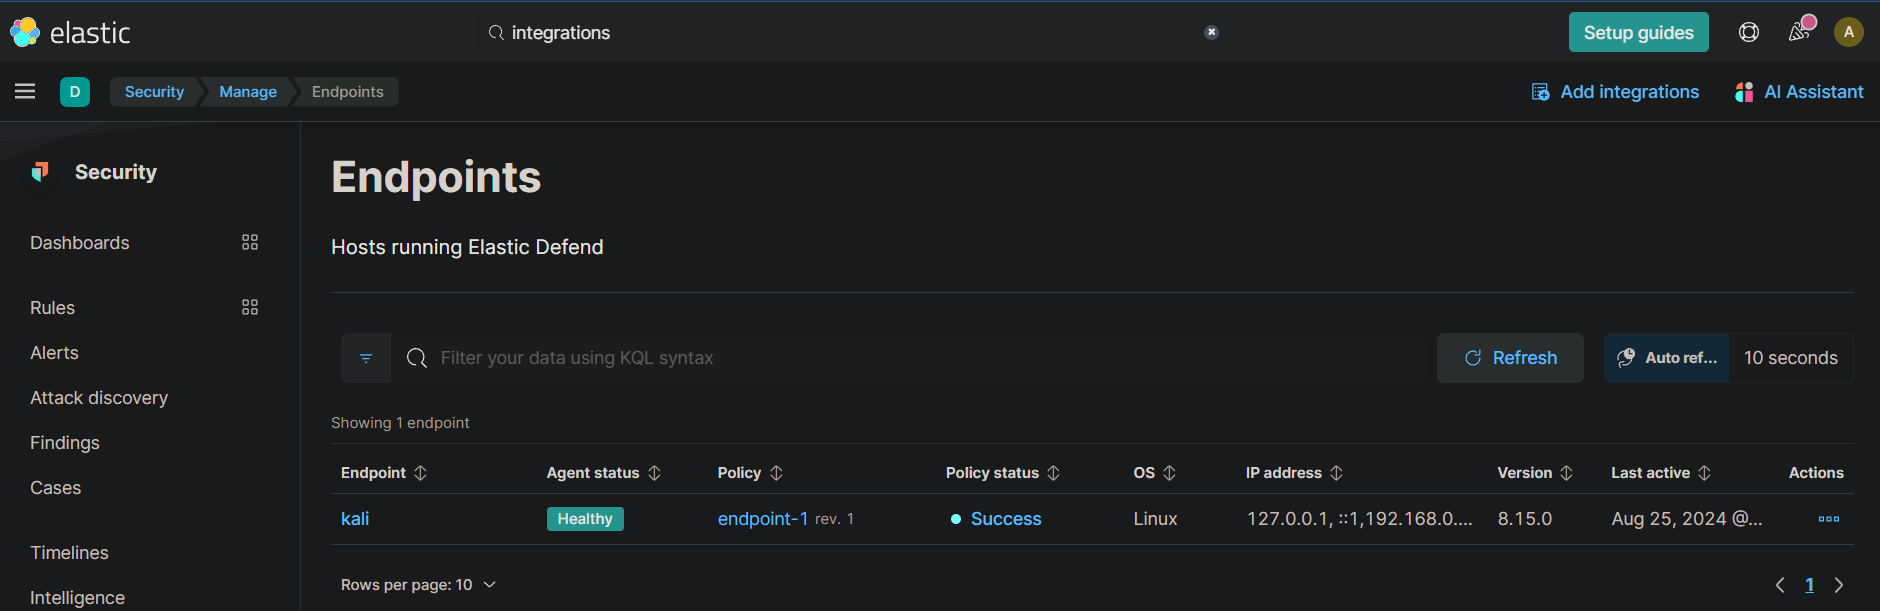
To set up the agent on your Kali Linux virtual machine, first, log in to your Elastic SIEM instance. Once logged in, navigate to the Integrations page by clicking on the Kibana main menu bar at the top left and selecting “Integrations” from the dropdown menu. In the search bar on the Integrations page, type “Elastic Defend” and select it from the results. This integration is specifically designed to collect and manage security data.
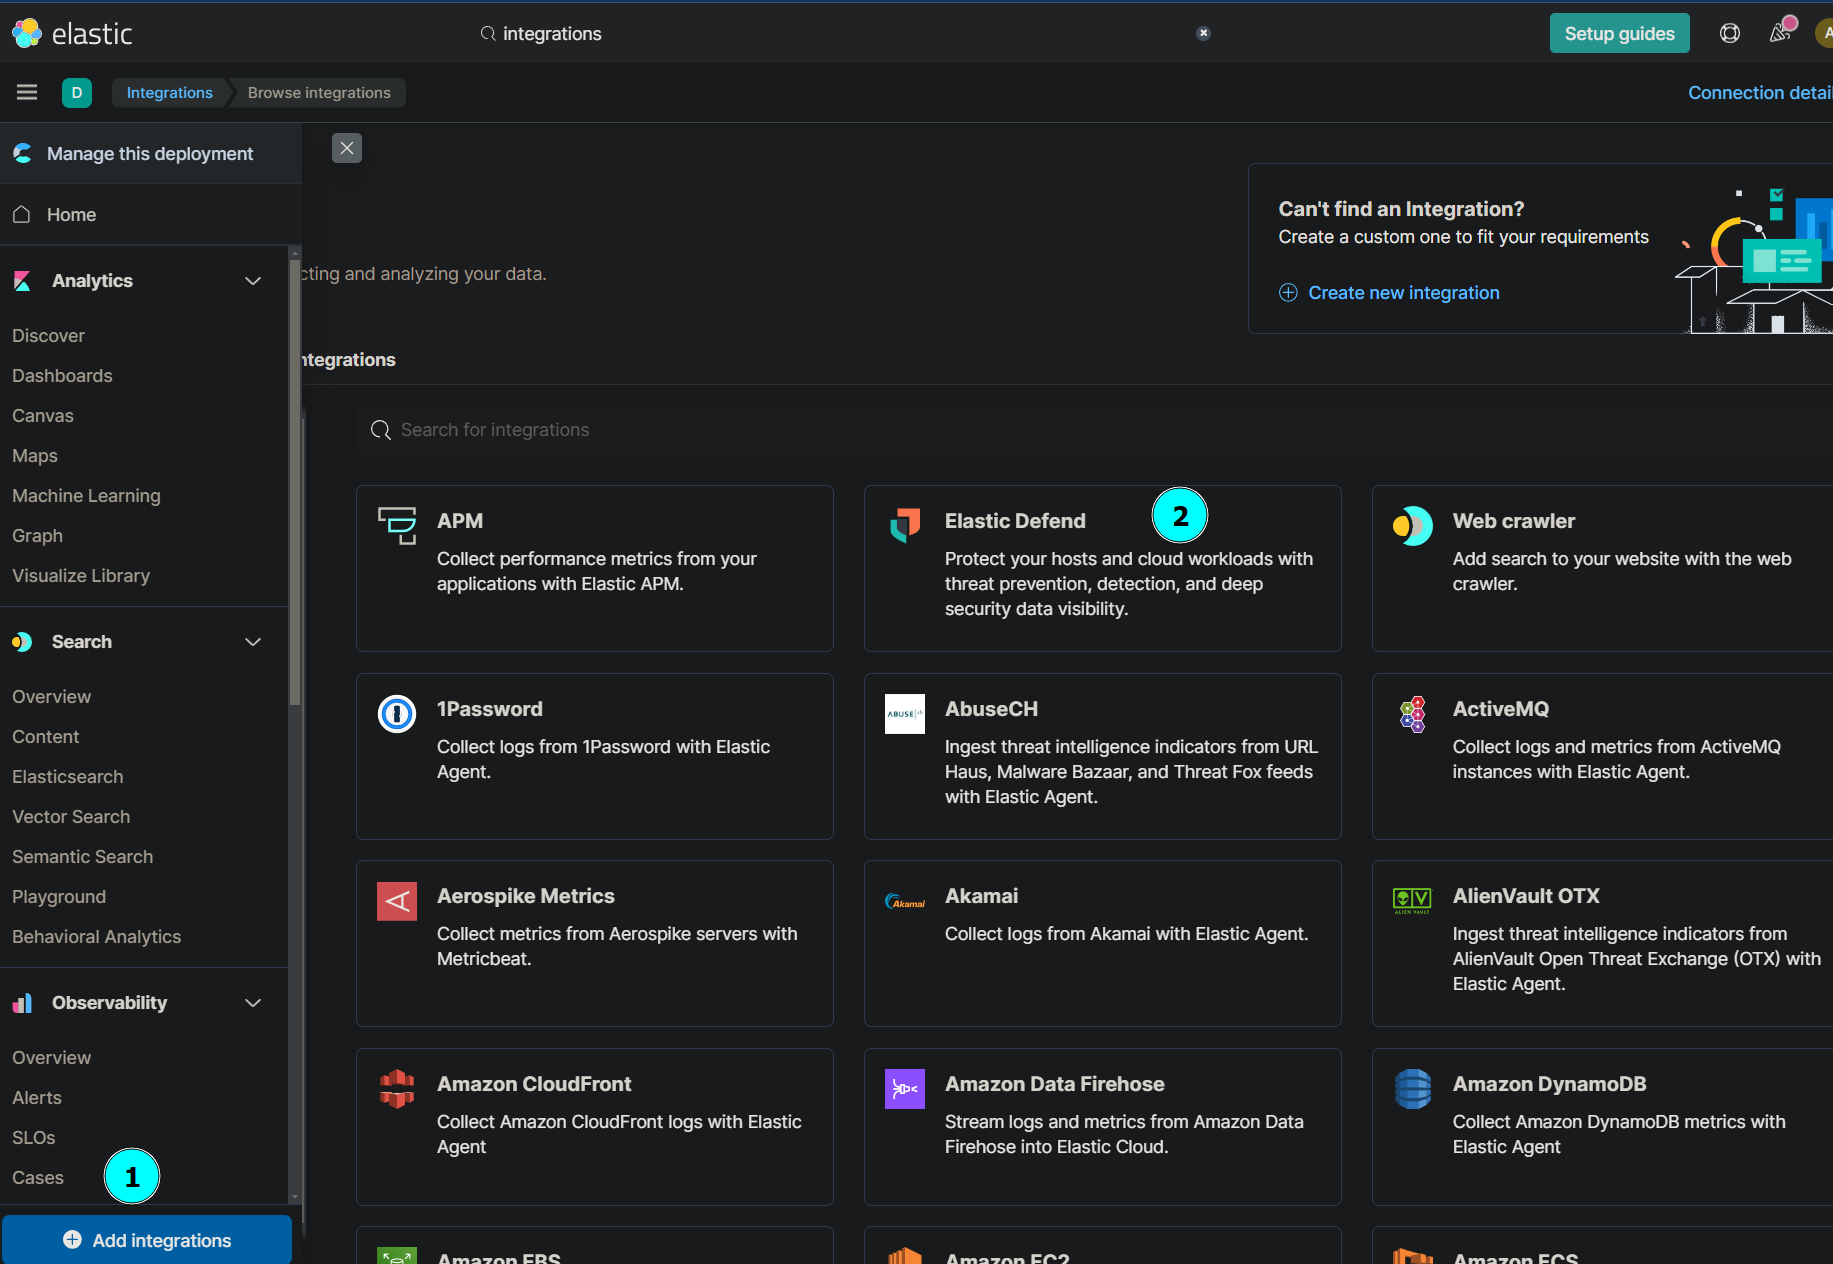
Click on “Install Elastic Defend” and follow the instructions provided to install the agent on your Kali VM. The installation process involves downloading the Elastic Agent package and enrolling it with your Elastic deployment. During enrollment, you’ll need to generate an enrollment token from the Elastic Cloud console, which will link the agent to your specific deployment. After completing these steps, the agent will be installed and configured to start collecting logs and forwarding them to your SIEM instance.
- To ensure the agent is functioning correctly, open a terminal on your Kali VM and run the command:
sudo systemctl status elastic-agent.service
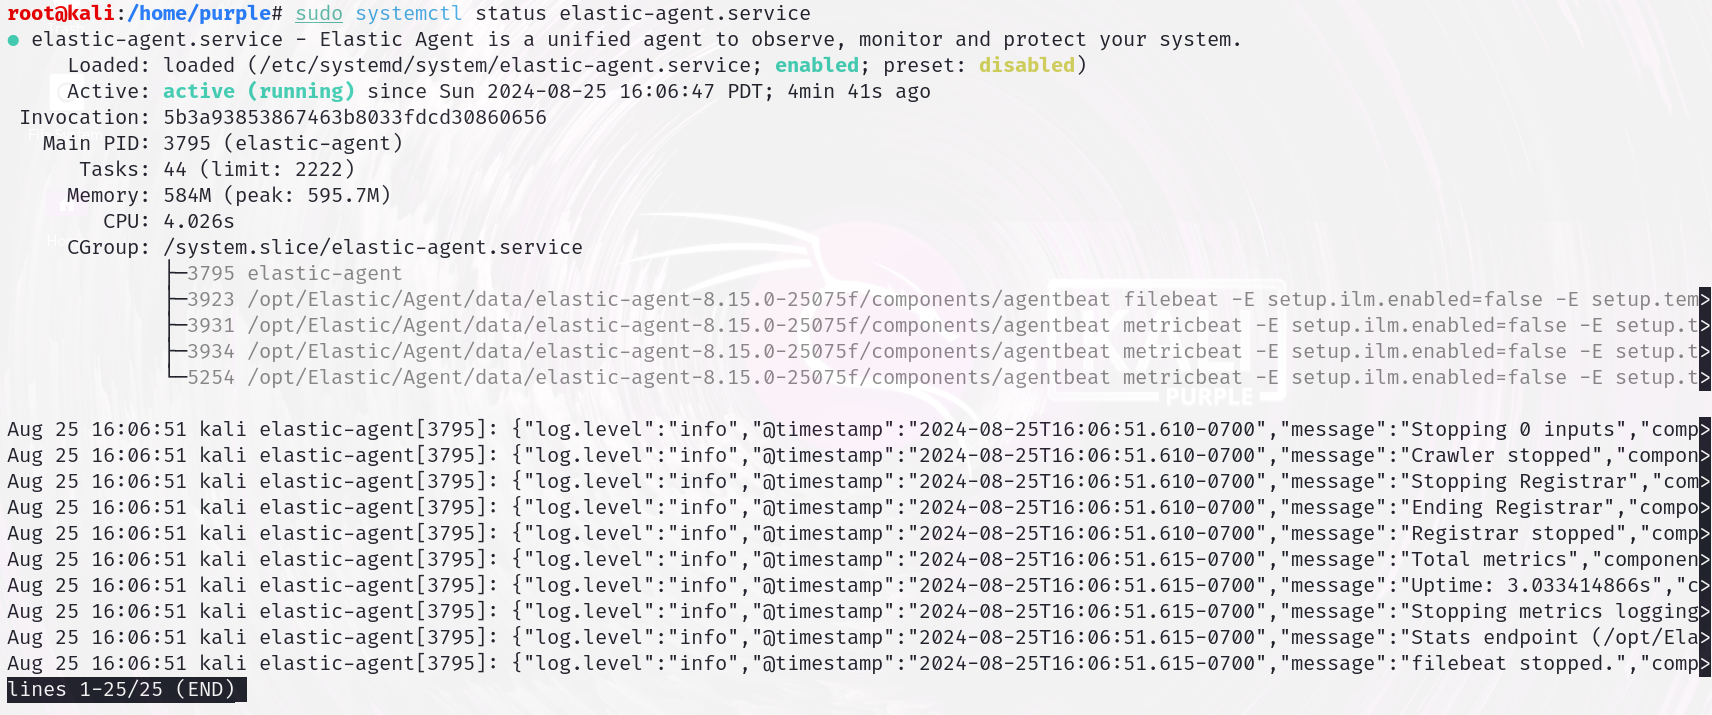
Note: You should see a status message indicating that the service is active and running. This confirms that the agent is properly installed and operational, ready to begin sending data to Elastic SIEM.
Generating Security Events
With your Elastic environment set up and the agent installed, it’s time to generate security events. Use Nmap, a powerful network scanning tool, to create logs that Elastic SIEM will capture. On Kali Linux, Nmap is pre-installed; on other distributions, install it via your package manager (e.g., sudo apt-get install nmap for Ubuntu/Debian).
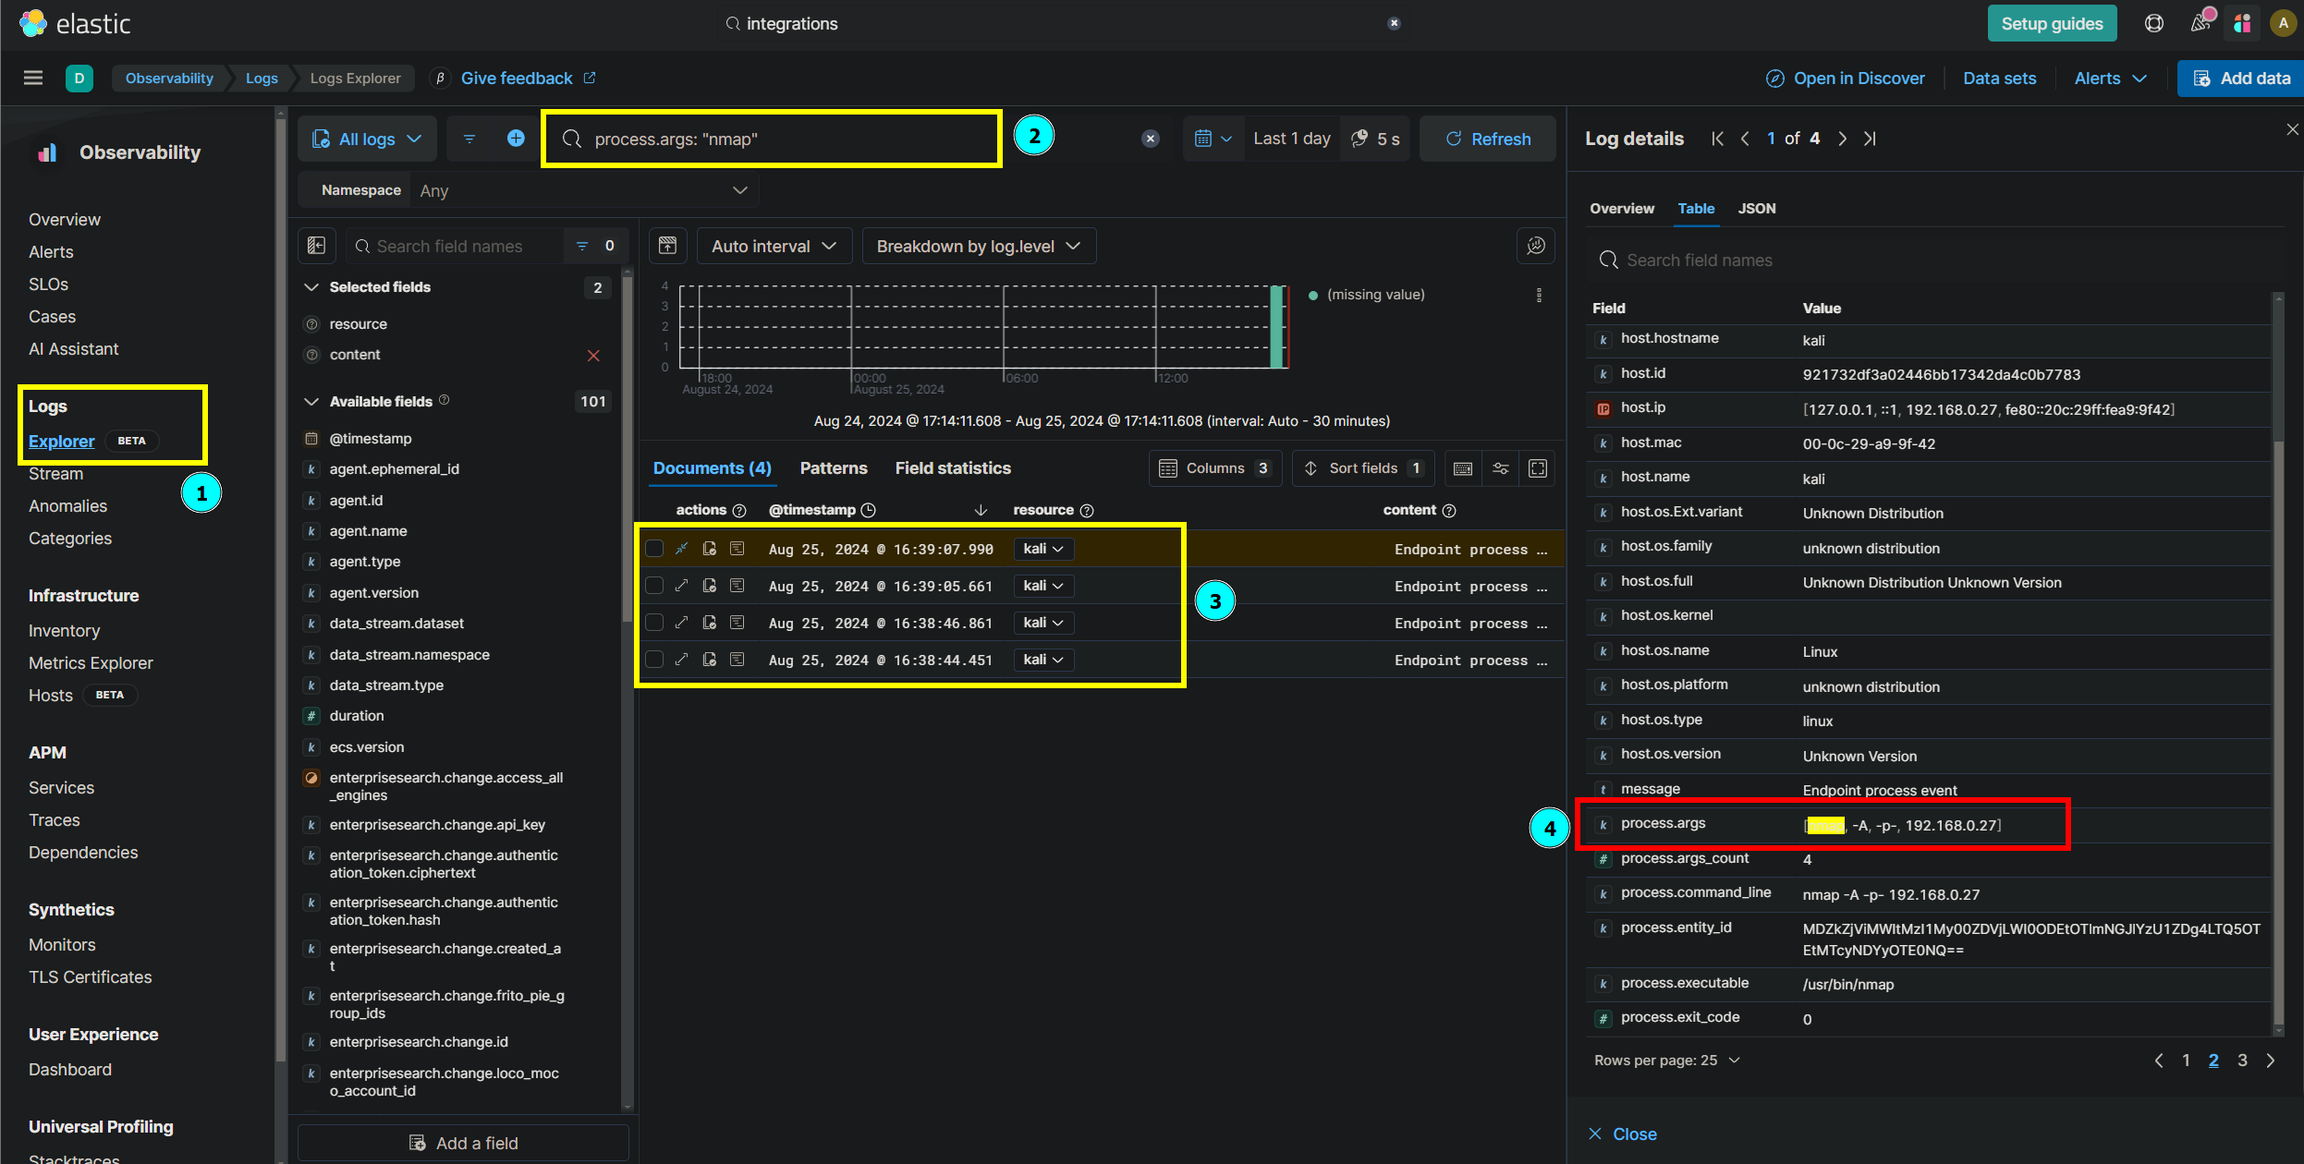
To generate events, run a full port scan on your Kali VM’s IP with nmap -A -p- 192.168.0.27. This will produce network activity that the Elastic Agent will forward to your SIEM for analysis. Remember, Nmap can be disruptive, so review its legal and ethical implications before use.
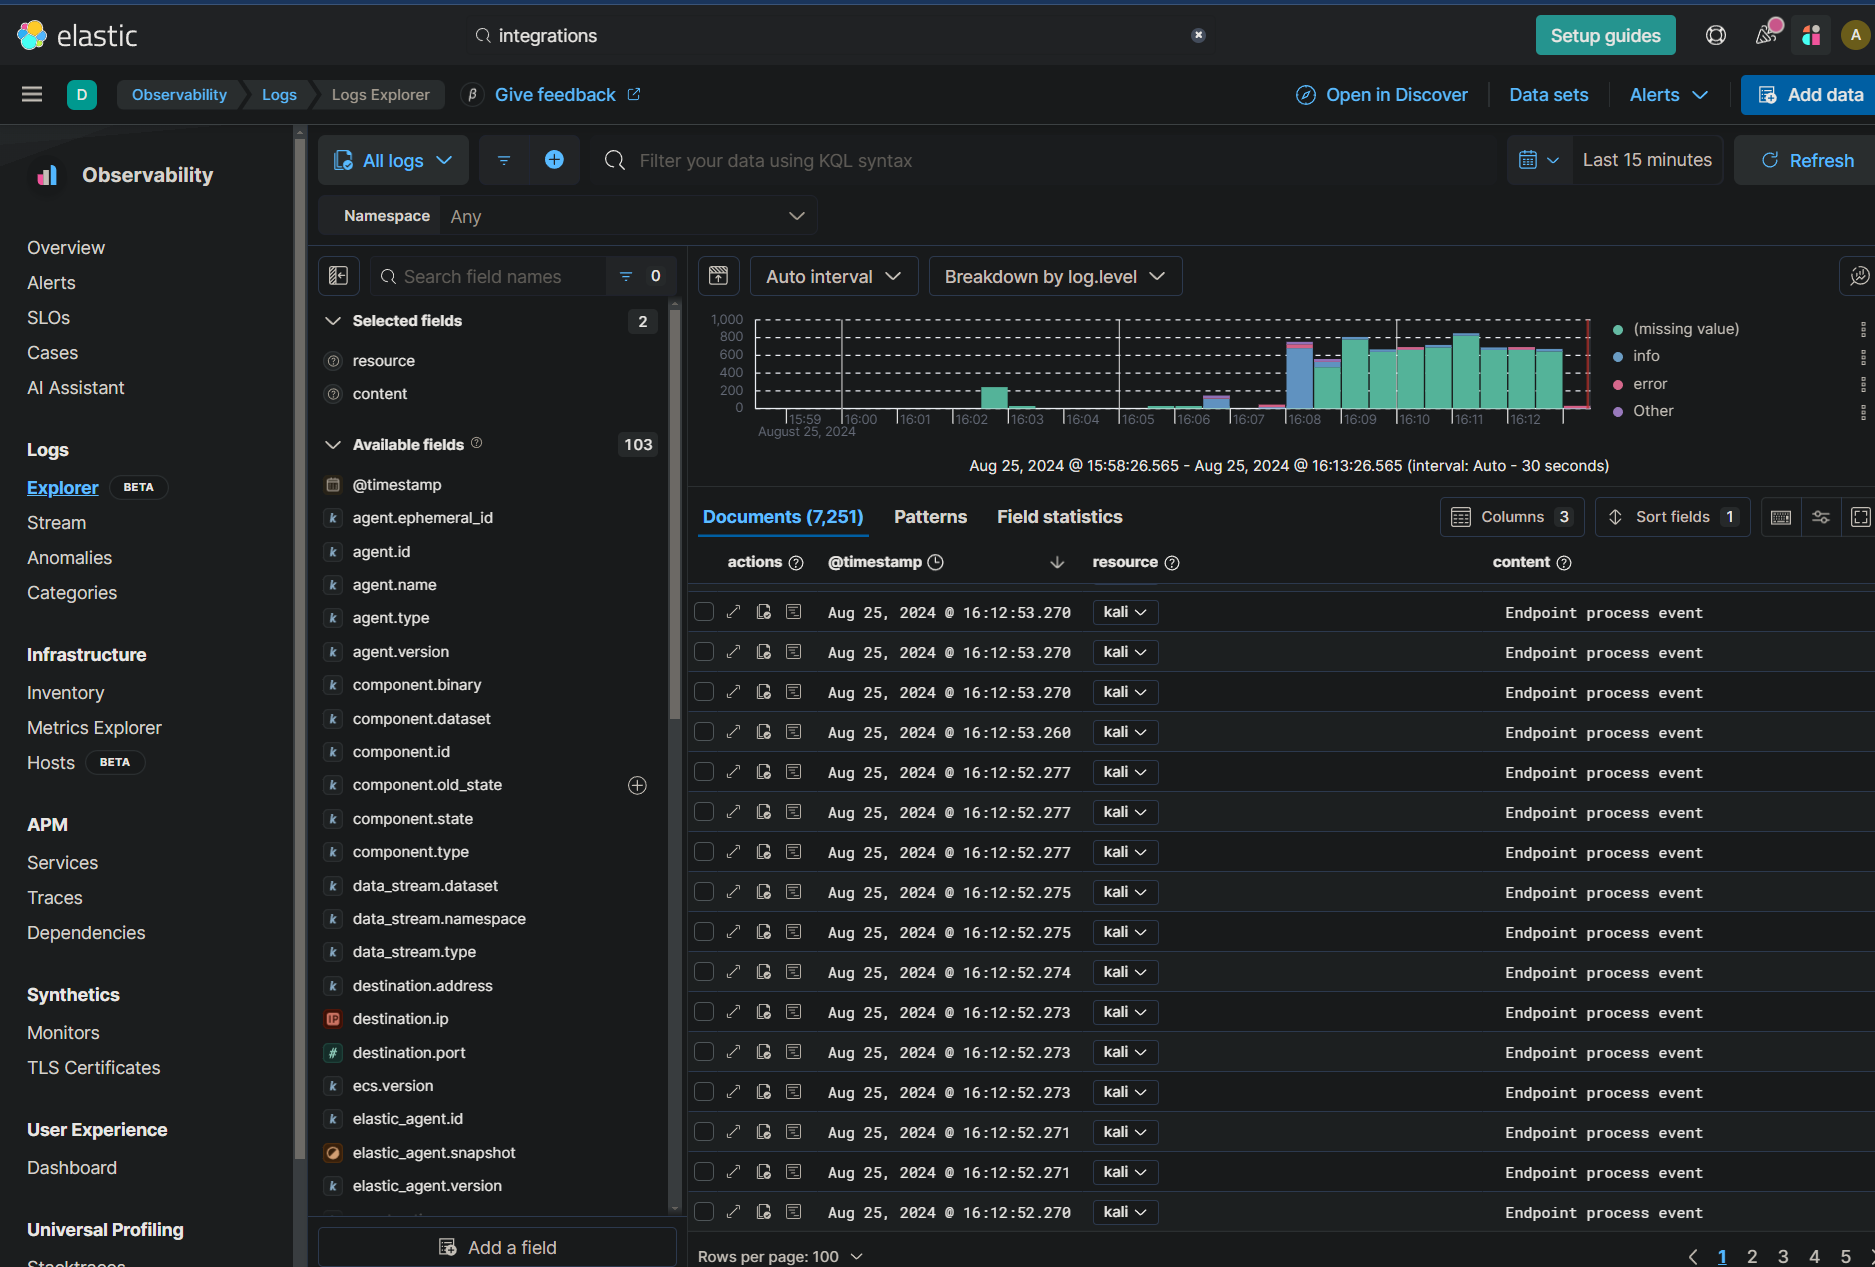
After the scan, check the Logs tab in the Observability section of the Elastic Cloud console. Here, you’ll find the logs generated by your Nmap scan, allowing you to see how Elastic SIEM captures and analyzes security events in real time.
Dashboard Creation
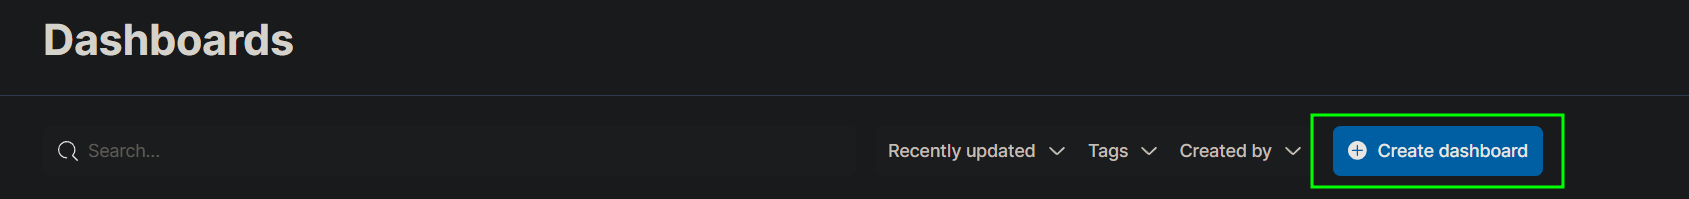
To better understand and analyze the security events captured by your SIEM, you can create a dashboard in Elastic that visualizes the data. Start by logging into your Elastic Cloud account and navigating to the Dashboards section under the Analytics menu. Here, click the “Create dashboard” button to start a new dashboard.
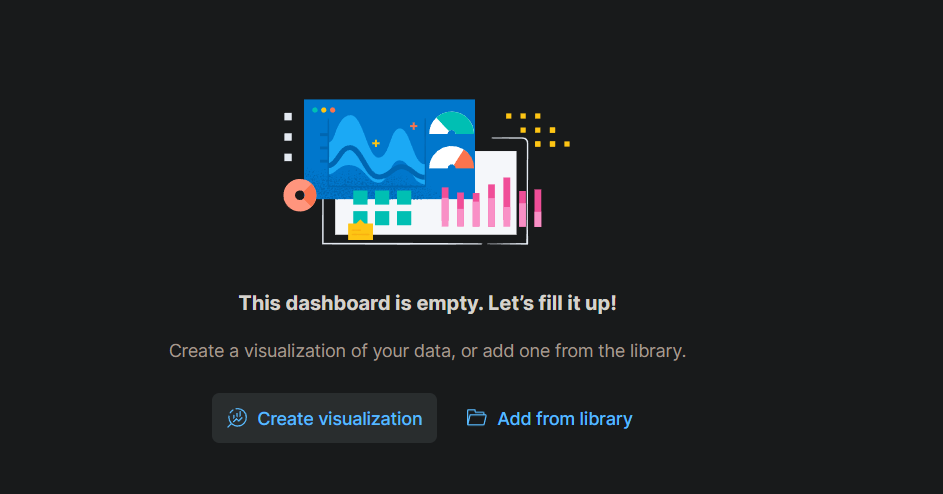
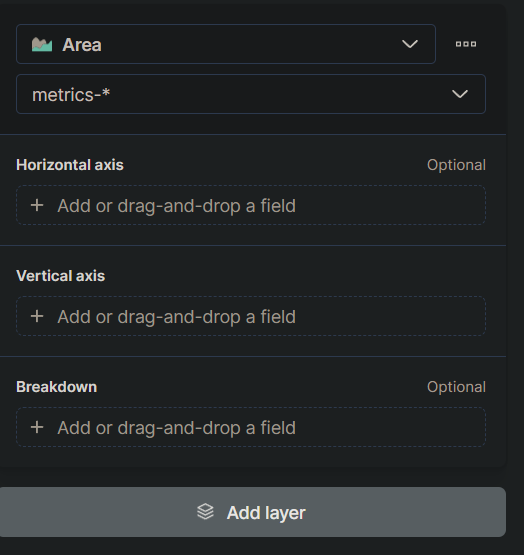
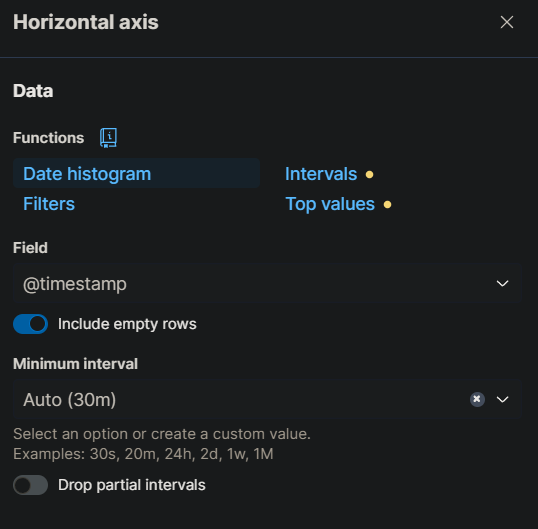
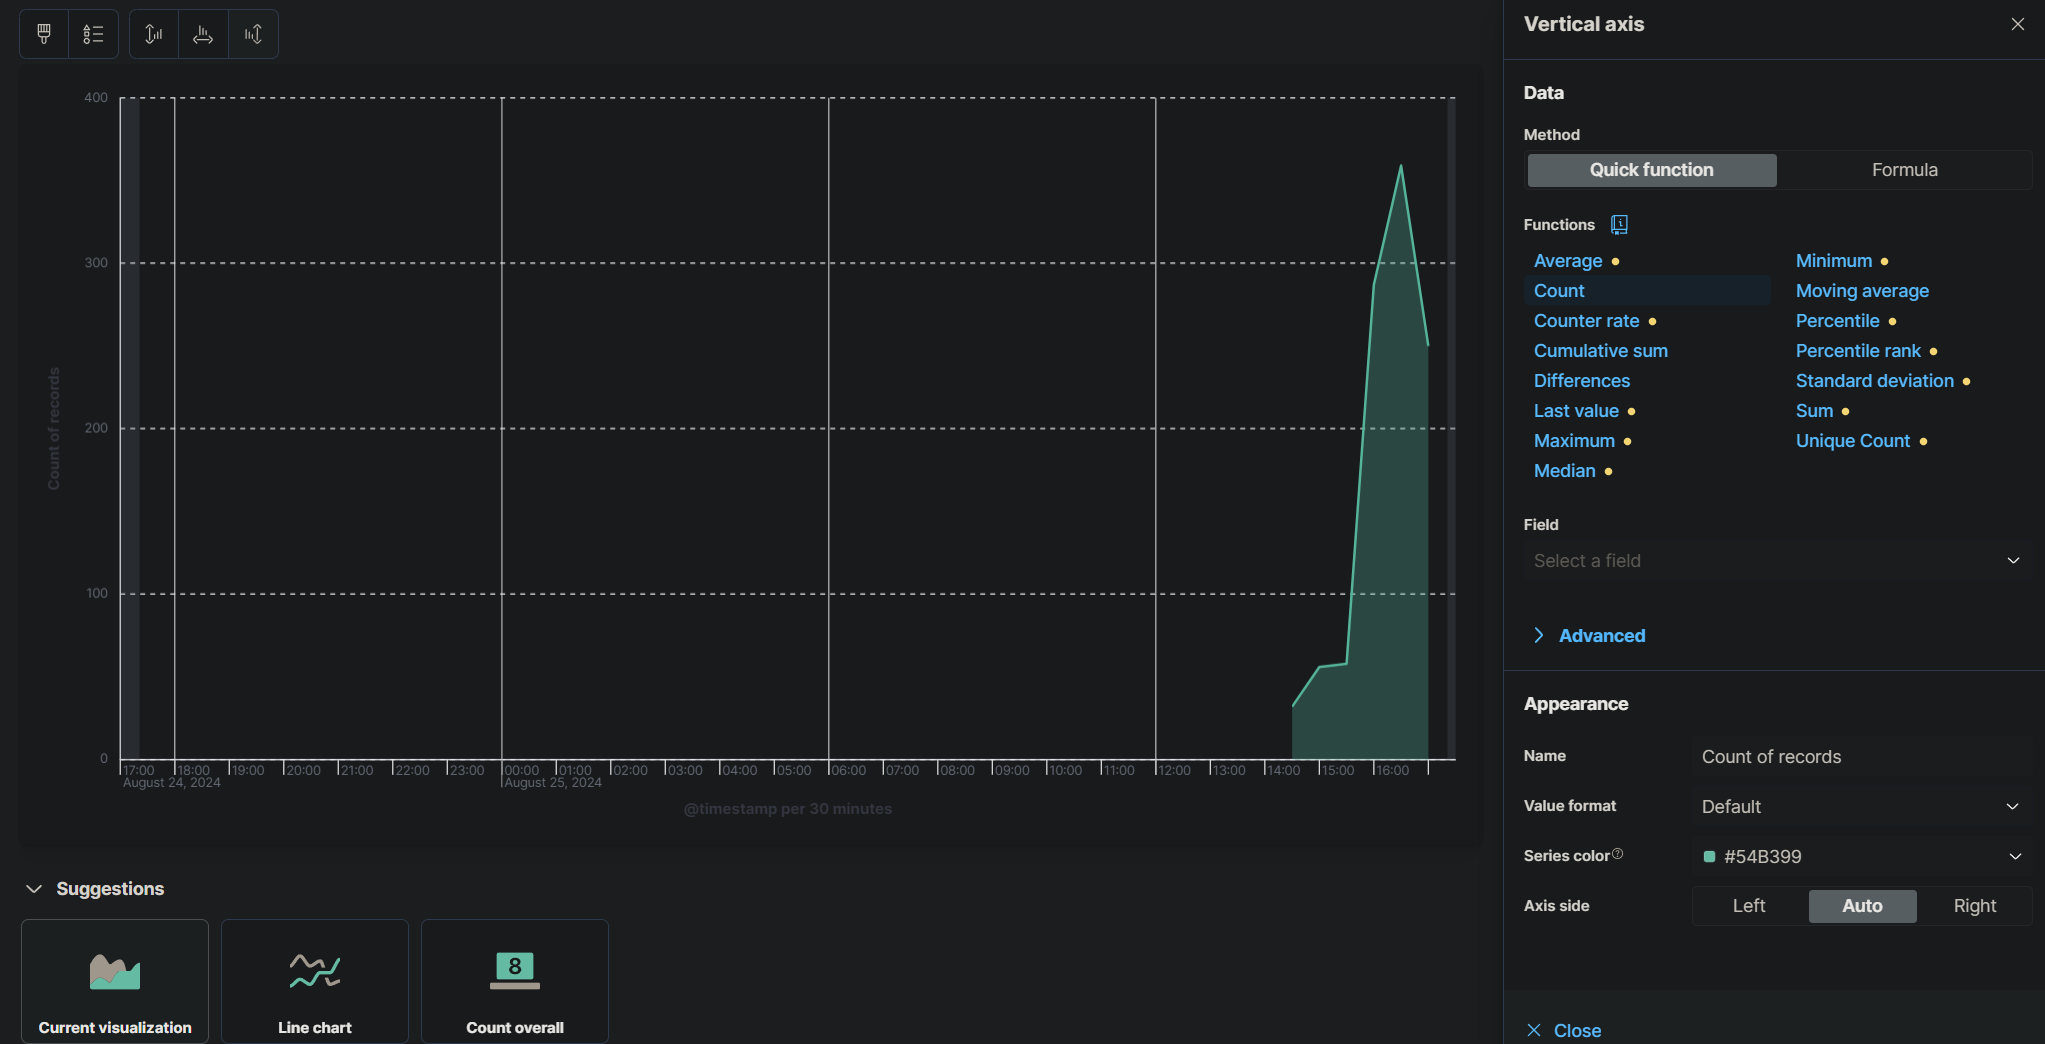
You’ll then add visualizations to your dashboard. Click “Create Visualization” and select a type of chart that best represents your data, such as an area or line chart. In the visualization editor, set “Count” as the metric for the vertical axis to show the number of events, and use “Timestamp” for the horizontal axis to display when these events occurred. This setup will create a time-based visualization that tracks security events as they happen.
Once you’ve configured your visualizations, save your dashboard. This dashboard will now provide a real-time view of security events, making it easier to spot patterns or anomalies in your logs. You can customize the dashboard further by adding more visualizations or rearranging the layout to suit your needs.
Alert Setup
The final step in this project is to set up an alert that will notify you if an Nmap scan is detected in your environment. In the Elastic SIEM, navigate to the Detections tab and click on “Create new rule.” You’ll create a custom query rule specifically designed to detect Nmap scan events.
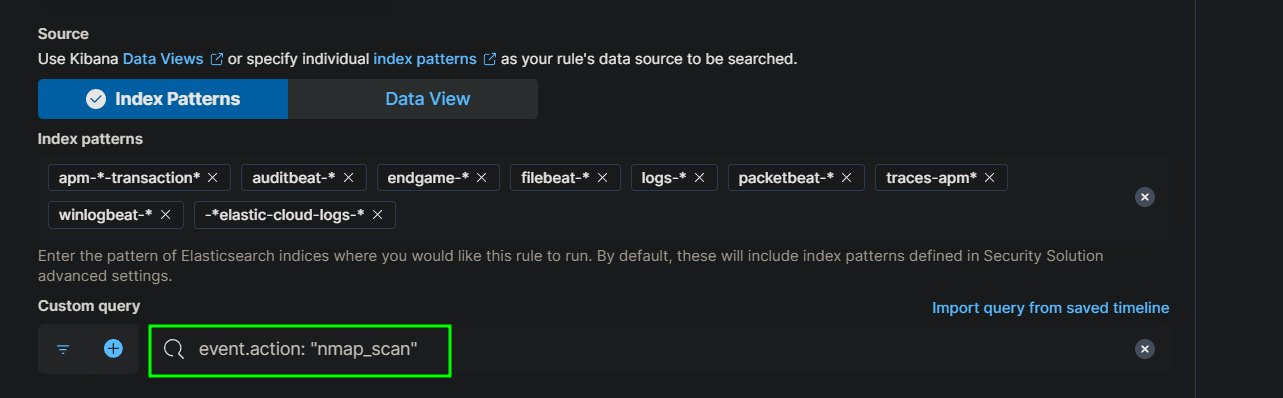
In the rule creation interface, define your rule by setting the query to something like event.action: "nmap_scan". This query will trigger whenever the SIEM detects an event that matches the action “nmap_scan.” Name your rule appropriately (e.g., “Nmap Scan Detection”) and assign it a severity level. You can keep the default settings for how often the rule checks for new events or adjust it based on your needs
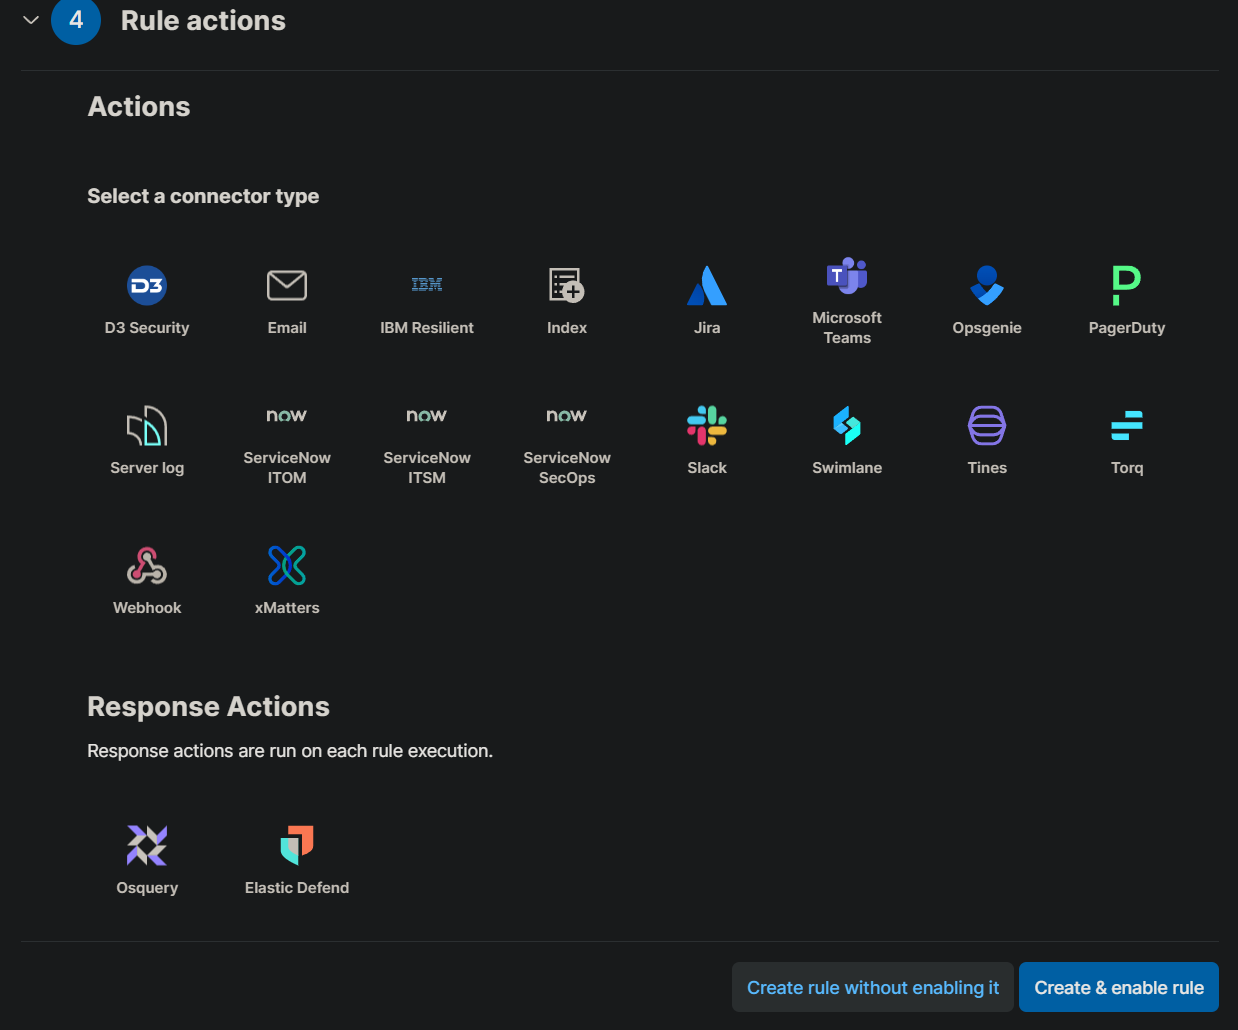
Next, decide what action should be taken when this rule is triggered. Options include sending an email, posting a message to a Slack channel, or triggering a webhook that integrates with other security tools. Once you’ve configured the action, finalize the alert by clicking “Create and enable rule.”

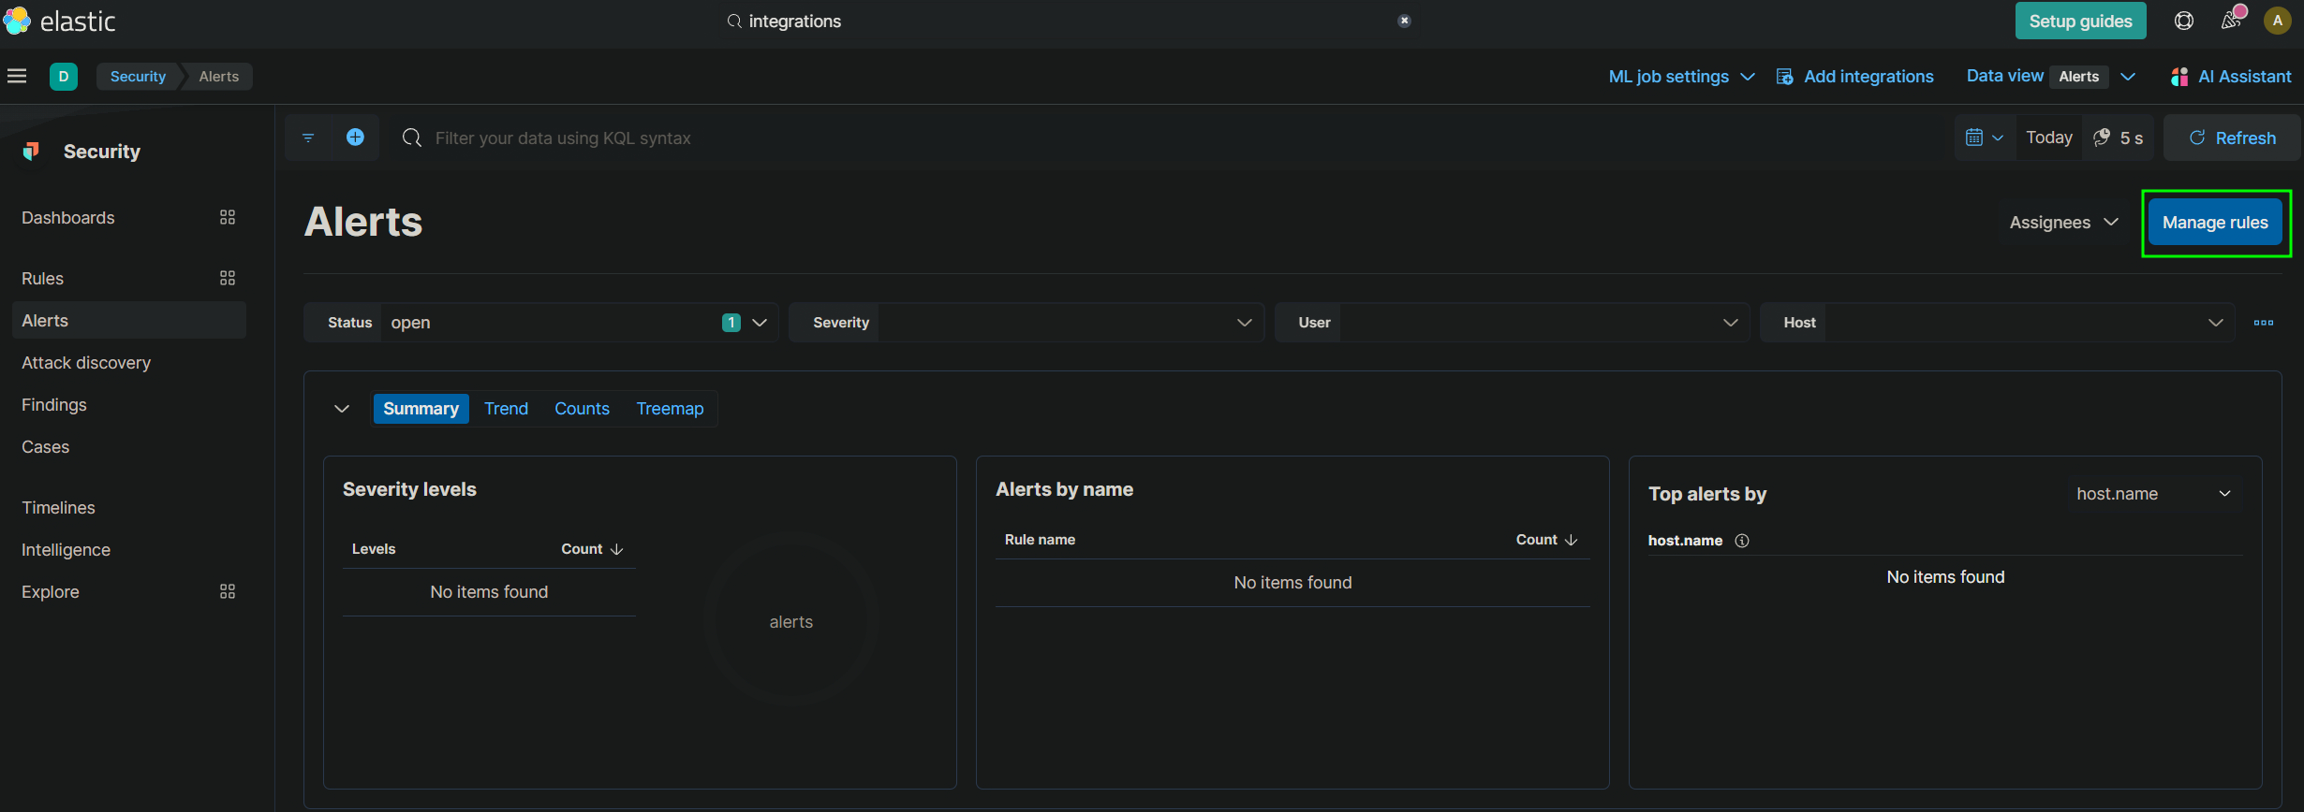
Your alert is now active and will continuously monitor for Nmap scan events. If such an event is detected, the alert will trigger, and the action you specified will be executed. You can manage and review these alerts in the Alerts section under Security in Elastic, ensuring you stay on top of potential security incidents.